
Phil Zarrow: Ron, when we talk about stencil printing, the basic foundation is transfer efficiency. Tell us about it.
Dr. Ronald C. Lasky: Well, Phil, you know about two-thirds of all end-of-line defects can be traced back to the stencil printing process. And so, transfer efficiency and its consistency is an extremely important metric.
Phil Zarrow: Right, and that goes back to in the industry, the legendary study that HP did in the mid-1980s.
Dr. Ronald C. Lasky: Yep.
Phil Zarrow: Mid 80s, when things were a lot simpler. And there they saw, as you're saying, 60-percent defects, and you and I have seen a lot worse, even when we've done process alignments.
Dr. Ronald C. Lasky: Yeah, and you know, none of us can find a paper on that, but we all believe it.
Phil Zarrow: Right, yeah, it's ... But we see it all the time, so it kind of works. I understand that, as I said, you and Chris Nash did some work.
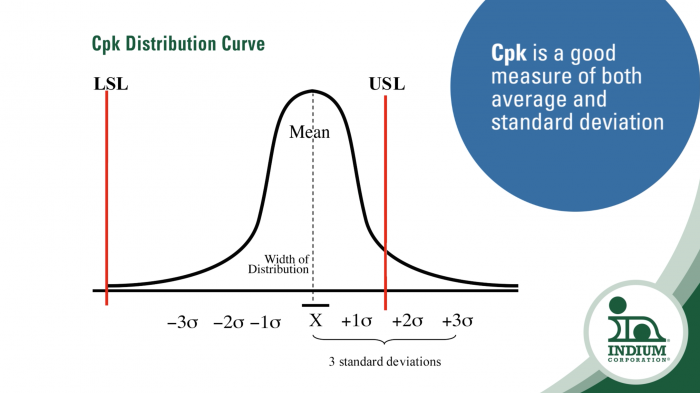
Dr. Ronald C. Lasky: Yeah. Well, you know, Chris has developed a lot of stencil printing data, and he came to me and said "What would be the best metric to use to analyze the data?" And I suggested Cpk. Because Cpk is the one metric that includes being concerned about precision, the tightness of the distribution, and where the average of the distribution is. So you have one metric that gets both of those important aspects.
Phil Zarrow: Okay. So what spec do you guys use?
Dr. Ronald C. Lasky: Typically, on the low side, 50 percent, and the high side, 150 percent.
Phil Zarrow: Okay, so why Cpk?
Dr. Ronald C. Lasky: Well, again, because of the precision, and the fact that it gets precision and average.
Phil Zarrow: Okay, good. So, how did you approach this?
Dr. Ronald C. Lasky: Well, Chris came to me and said, "Okay, you've given me Cpk, I think it's great, but now I want to tell the difference between two batches of data. I've got one that's 0.95, and one that's 1.0, and, of course, I think the 1.0 is better, but how can I say it's statistically significantly better?"
Phil Zarrow: Right, so how did you solve this problem?
Dr. Ronald C. Lasky: Well, it was a little bit harder than I thought. I went back thought about it, and, fortunately, since I'm a professor at Dartmouth, I have a lot of textbooks on these topics because I teach statistics and statistical process control there. So, I studied—it took me the better part of a day, and I found a textbook that actually allows one to calculate a confidence interval on Cpk. So, the one with 0.95, I get a confidence interval on it, it's either from 0.9 to 0.99. And then the one that's maybe 1.0, I get a confidence interval on that. And if the confidence intervals are separated, they don't overlap, we can say with 95-percent confidence they're statistically significantly different.
Phil Zarrow: That's very good, but that sounds like one complicated formula.
Dr. Ronald C. Lasky: Yeah, it's not something you can look at and just get a sense for; it's pretty complicated. But with the magic of Excel, I was able to put a formula in there, and I also developed for Chris a formula to even calculate the Cpks in the beginning. So, he has an Excel spreadsheet that he can do all this.
Phil Zarrow: So, the difference between a Cpk of 95 percent and 100 percent would be pretty significant.
Dr. Ronald C. Lasky: It's going depend somewhat on the data size. If your data set’s about a thousand, that's definitely true. But even if the difference is just like 0.99 and 1.0, if your data size is large enough, that even could be statistically significant, say it's like 30,000.
Phil Zarrow: 30,000?
Dr. Ronald C. Lasky: Yep.
Phil Zarrow: We can do that now?
Dr. Ronald C. Lasky: Yeah, well, that's one of the things about modern technology. You know, the laser scanning systems? You can make 30,000 measurements pretty quickly. So, that's the kind of data sets that we have. I was just working on some recently where it was like in the 50,000 range.
Phil Zarrow: Well, your work sounds like a very valuable addition to the state-of-the-art printing.
Dr. Ronald C. Lasky: Yeah, we don't really think anybody else is doing this right now.
Phil Zarrow: Very good. So, where can we found more information on this?
Dr. Ronald C. Lasky: You can contact me at rlasky@indium.com, or go to the www.indium.com website.
Phil Zarrow: Ron, thank you so much for sharing your excellent work.
Dr. Ronald C. Lasky: Thank you.