 Folks,
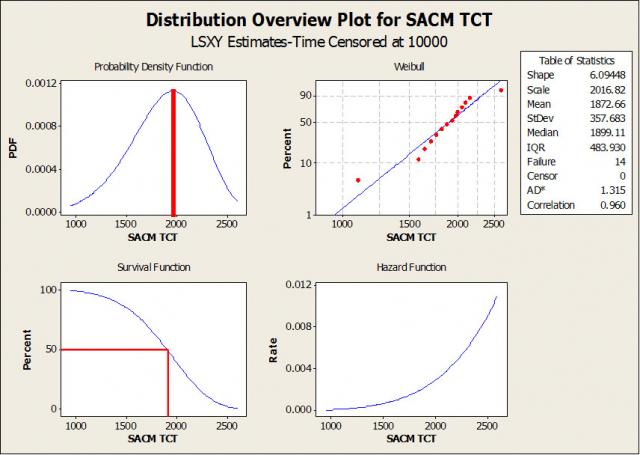
In the last posting, we saw how Weibull analysis helped us to determine that SACm® lead-free solder (SAC105 with about 0.1% manganese) has comparable (actually better) thermal cycle performance versus SAC305 solder. Software like Minitab will give us even more detailed information about the performance of the solder joints in stress testing as we see in Figure 1, above.
In addition to the Weibull plot, we also have the Probability Density Function (PDF), the Survival Function and the Hazard Function. The PDF tells us when it is most likely that a test board will fail in a test population, as shown by the inserted red line. We see that it is a little less than 2,000 cycles. The Survival Function shows the percent of surviving test boards. Weobserve that the expected life (the 50% point) is quite close to the maximum of the PDF. The Hazard Function tells us the rate at which the test boards are dropping out. It increases with time, but there are few boars left so the PDF drops down at the end of the test, even though the fall out rate is the highest.
 It is interesting (and perhaps appropriate as Halloween approaches) to consider if human mortality follows a Weibull distribution. I used some data for the Centers for Disease Control that are a little over ten years old, for males in the US. So, the mean life expectancy is a little low at 72 years. (I was a little lazy, the old data were a little easier to work with than new data, some conversions are needed to make it work.) The data appear above in Figure 2.
As you can see, just like a solder joint, your life expectancy can be modeled quite well by the Weibull distribution.
Cheers,
Dr. Ron