Folks,
The Weibull distribution is arguably the most important distribution in failure analysis of leaded and lead-free solder joints. It is the first thought of someone trying to model thermal cycle, drop shock, or other failure modes associated with through-hole and SMT assembly.
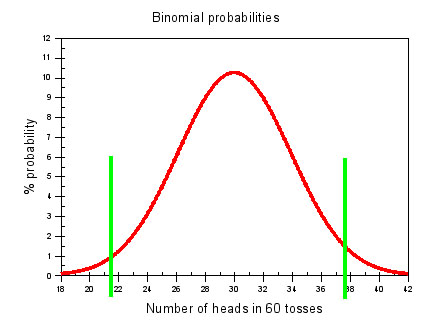

The Likelihood of Getting Heads in 60 Coin Tosses is Described by The Binomial Distribution
The Weibull distribution was invented by Waloddi Weibull in 1931. This invention fact was recounted by Dr. Robert Abernethy in his famous textbook on Weibull analysis, The New Weibull Handbook. This statement may not seem unusual, until we ponder that all common distributions in statistics were discovered, not invented. The three most common statistical distributions are the Normal, Poisson, and Binomial distributions. As an example of a discovered statistical distribution, let’s consider the Binomial distribution. This distribution describes, among other things, the odds in flipping a coin. If you flip a fair coin 60 times, you are most likely to obtain 30 heads (H) and 30 tails (T), but getting 29 H and 31 T or 32 H and 28 T would not be all that uncommon. Mathematical analysis shows that the curve below results. If a coin flipping experiment is performed many times, this curve will faithfully predict the results. The curve is not invented it is discovered from the deep theoretical underpinnings of the Binomial Distribution.
Waloddi Weibull 1887-1979
The fact that the Weibull distribution was invented suggests that Weibull selected it because it fit many types of failure data. He defined cumulative Weibull distribution is defined as:

Where eta is the characteristic life or the scale function and beta is the slope, were as F(t) is the cumulative fraction of failures. Weibull proposed this function because for beta less than 1, F(t) describes “infant” mortality fails. In this situation the failure rate is decreasing with time. For beta greater than 1, it describes “wear out” failures, where the failure rate is increasing with time. In electronics, we typically try to weed out infant mortality by using “burn in.” For beta equal to 1, the failure rate is constant. These three scenarios are shown in the figure below.

So typically, in electronics failure analysis, we are plotting failure data versus time to determine beta and eta, typically with software like Minitab®.
In the next posting we will analyze some failure data to determine eta and beta and discuss their significance.
Weibull himself was a curious character and much of the available information on him is chronicled by Abernethy.
For sure Weibull was a vigorous man. His second wife was almost 50 years his junior and he fathered a daughter at about 80 years of age!
Cheers,
Dr. Ron