After a delightful lunch with Rob, Pete, and the Professor, Patty settled into her office to prepare a lecture on statistics. She was still enjoying the academic environment and this weekly lunch was part of it.
Rob and the Professor were both amateur World War II historians, and Patty tried to limit their lunchtime discussions on this topic. Somehow, the two of them got Pete hooked on the topic. So, it was becoming harder to chat about other things. The three agreed that, if Patty would read just one book, they would completely stop talking about WWII at lunch. The book was A Simple Soldier by John Gess. The book is about a common solder in Germany’s army in WWII. The soldier, named Sepp, was simply drafted and served because he had to. Patty had to admit the book was captivating, and she soon found herself unable to put it down. For a few nights she was reading until 2 AM! Now Patty was the one going on and on at lunch about the adventures of Sepp. The level of detail in the book astounded her.
As Patty prepared for her class, she noticed that she had received some emails from the students in her class regarding their term project. Each student had to do a term project on some topic in statistics. Patty found at least three of the topics fascinating. One was “Benford’s Law.” This “law” explains why “1” is the leading number about 30% of the time in a wide variety of data sets including electricity bills, death rates, street addresses, populations, etc. Interestingly, it does not depend on what units one uses. The effect relates to the commonness of logarithm’s natural and man-made data sets. The next topic is called “The German Tank Problem.” In this problem, the allies estimated the total number of German tanks in WWII by using serial numbers from parts of the tanks. The estimates ended up being very accurate. The third topic was one that Patty was familiar with, but didn’t know it had a name; Simpson’s Paradox. Some years ago, when she was working for ACME, they were in a yield contest with their main competitor, AJAX. The products in the yield contest were laptops and mobile phones. ACME had better yields in both products, but their overall yield was less than AJAX’s. The reason is easy to see in the table below. AJAX manufactured more of the higher yield mobile phones. Even though their yield was less in both, the overall yield was higher.
Figure 1.
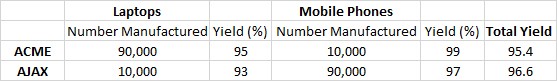
Although ACME has better yield in both laptops and mobile phones., AJAX’s high number of mobile phones gives them a higher total yield.
In about 20 minutes Patty was prepared for her class and had 15 minutes to spare. She checked her emails and there was a note from ACME CEO Mike Madigan:
Dear Professor Coleman,
We occasionally go to White River Electronics to subcontract assembly on small jobs, when we are swamped. The owner, Frank Piper, is concerned that his processes are producing too many solder balls. Could you and Pete check it out? He is only about 20 miles from you folks.
Thanks,
Your faithful student,
Mike Madigan.
PS: You will chuckle when you meet him Re his name.
After Patty taught her class she found Pete.
“Hey, Pete! It looks like we have a Mike Madigan assignment,” said Patty.
Pete had sort of a strange look. And, both he and Patty stared at each other for a split second. Then, they both started laughing. This was the first time that Patty knew about some potential “gig” before Pete!
Patty contacted Piper and, in a few days, she and Pete were at White River Electronics (WRE).
As they walked toward the front door of WRE, Pete said, “I’ll bet they are a ‘data and dump’ company.”
“No way,” said Patty. Not if they are an ACME subcontractor. We would have never allow that.”
“Don’t forget, they were retained after we left,” Pete teased.
A “data and dump” company was one that dutifully collected process data and did nothing with the data; i.e. it got “dumped.”
Patty was hoping this was not the case, but she knew it could be true.
As they walked into WRE, a smiling, hyperactive Frank Piper meet them with a pipe firmly affixed in his mouth. The entrance was filled with a not unpleasant smelling smoke. Patty noticed several “No Smoking” signs prominently displayed.
After pleasantries, Frank took them out to the line and introduced them to the quality technicians. Patty suggested that she and Pete would talk to the techs and get a handle on the situation. As Piper left, Patty was surprised that he had smoked his pipe the entire time that they were with him. Patty then started talking to Janis Hopkins, the lead quality technician.
Janis explained how they collect their quality data and showed Patty some of the quality sheets that had today’s defect data noted.
“What do you do with the data after you collect it,” Patty asked Janis.
“We file it in this drawer,” Janis answered.
Patty looked at the filing cabinet that Janis pointed to. It was very well organized with many month’s-worth of data.
“What is done with this defect data after it is filed away?” Patty asked.
“Nothing. It just stays in the filing cabinet,” Janis answered.
At this Pete rolled his eyes and mouthed “I told you so” to Patty. WRE dumped their data into a filing cabinet and did nothing with it. WRE was a “data and dump” company
“Janis, Mr. Piper, claims WRE’s worst defect is solder balls. How does he know that?” asked Pete.
“Our worst defect is probably tobacco ash from his pipe,” Janis joked. “Seriously, he just seems to have a thing for solder balls, I think shorts are worse,” she finished.
Patty and Pete chatted for a few minutes. They decided to plot some of the recent defect occurrences in a Pareto Chart. The results were as shown below.
Figure 2.
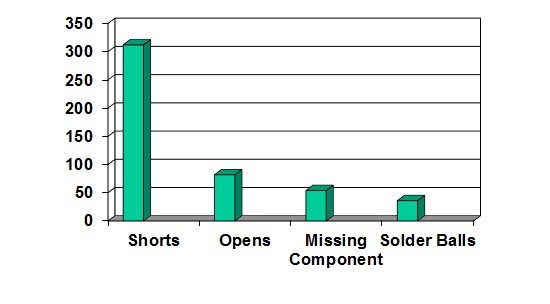
Pareto Charts list the defect modes in order with the greater number of occurrences first. This feature helps to prioritize which defect modes on which to focus.
“Janis, Peter and I made a Pareto Chart of the defects for the last few weeks. You were right! Shorts are worst; solder balls are almost a non-issue,” Patty said.
Janis was curious about what a Pareto chart was and was fascinated about its usefulness and simplicity.
“Janis, the Pareto Chart concept is where the “80-20 Rule” comes from. Eighty percent of our defects come from about 20% of our defect modes. You can see that it is approximately true for our data,” Pete elaborated.
Patty looked at Pete and could see that he was a little more interested in Janis than the 80-20 rule.
Patty and Pete went to Piper’s office and explained the Pareto Chart data. Then, they helped him to develop a continuous improvement plan for WRE’s assembly defects. They also got a commitment that the data collected would be used in real-time to keep process yields high and defects in check. As the trio left Piper’s office for lunch, Patty noticed about 10 “No Smoking” signs in his office.
They had a pleasant lunch and Patty had to ask, (though she tried not to be rude), “Mr. Piper, I noticed many ‘No Smoking’ signs in your office, yet your smoke there,” Patty asked timidly.
Piper chuckled, “I love my pipe. If I see a ‘No Smoking’ sign and I want to smoke, I just take the sign down and keep it for a souvenir!”
At this the three of them headed back to Piper’s office to sum up the meeting.
WRE was co-located in a building with several other companies. Riding an elevator was required to get to Piper’s office from the outside. On their way back to his office, they entered the elevator with Piper smoking his pipe. A “No Smoking” sign was prominently displayed inside.
A woman in the elevator look indignant and said to Piper, “Sir, don’t you see the ‘No Smoking’ sign?”
“Yes madam I do. But, this pipe is either going to stay in my mouth or ………….1“
Patty and Pete were aghast at the situation, but said nothing.
On the way back to Ivy U, Pete commented, “Wow! Have you ever seen such an inveterate smoker?”
“Never! Nothing even close. I have to say the aroma of the pipe smoke was pleasant; some sort of apple aroma. But, I knew the second hand smoke was not good for anyone,” Patty responded.
“Hey Pete! Maybe it is my imagination, but I thought you looked a little too interested in Janis,” Patty teased.
“Who me?” Pete teased back.
Epilogue:
Within one month, defect levels had dropped 70% at WRE, due mostly to using Pareto Charting of data to prioritize defect reduction action plans. WRE was no longer a “data and dump” company. Oh, and Pete and Janis were now an “item.”
1.Due to the “g” rated nature of this blog, I cannot exactly quote what Piper said (it was only PG, but I don’t want to offend). If you are interested in what he said, send me an email at [email protected] and I will tell you. As with all Patty and the Professor stories, this one is based on a real event.
Cheers,
Dr. Ron