In the world of electronics assembly, the utilization of high-quality alloys is critical to a successful product, and is verified through accurate and precise analysis of the material. IPC J-STD-006C states that “the percentage of each element in an alloy shall be determined by any standard analytical procedure with sufficient resolution.” When I read through the Joint Industry Standard, I found this phrasing to be particularly vague, since many of the routine material inspections refer to a certain IPC method. The majority of labs involved in the analysis of high-purity metals likely employ ICP-OES, or inductively coupled plasma optical emission spectroscopy. Hopefully, this post will shed a little light on the specifics of ICP-OES, as well as the expertise the technique requires.
The beauty of ICP-OES is the ability to measure the concentration of all metal analytes with high sensitivity, simultaneously. Once the sample has been prepared in a liquid medium, the full analysis on the instrument only takes a couple of minutes. The sample solution is pumped into a nebulizer where it is converted to a mist. The mist travels into a quartz torch, where it subjected to plasma. The plasma is produced by the coil of a radio frequency (RF) generator that surrounds the torch and creates a powerful electromagnetic field. A gas (almost always argon) is supplied to the torch, and is subsequently ionized, producing a high-temperature plasma (this is the “ICP” of ICP-OES). When the sample encounters the torch, the atoms become ionized by the ionized argon. The atoms of each element are constantly being stripped of electrons and regaining electrons, and this process emits electromagnetic radiation, (or more simply, it produces light). The wavelengths of this radiation are qualitatively indicative of specific elements, and the intensity of the radiation for each wavelength corresponds to the concentration of the element. The light enters the spectrometer (OES), where it is separated by wavelength, and the intensity is measured by detectors. This generates an emission spectrum depicting the radiation intensity within a range of relevant wavelengths. The intensity of the wavelengths that correspond to the elements of interest are compared to and quantified by an established calibration curve. This curve is typically a linear regression created by measuring a series of solutions containing known concentrations of the analytes.
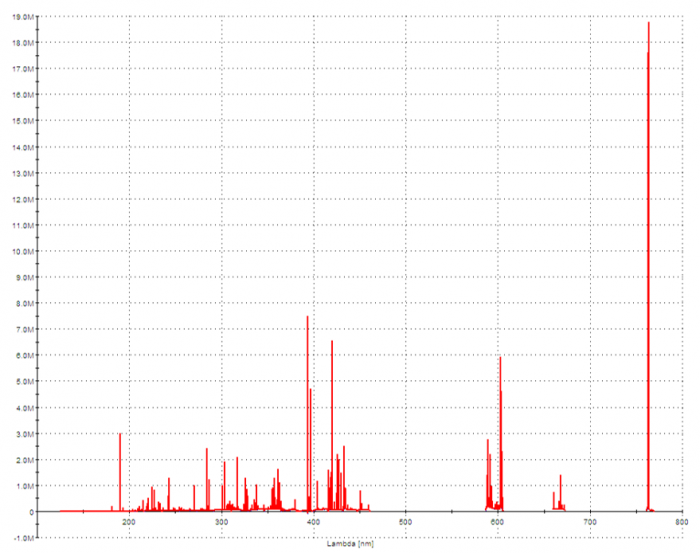
Compositional Analysis of SAC305 by ICP-OES: Full Spectrum
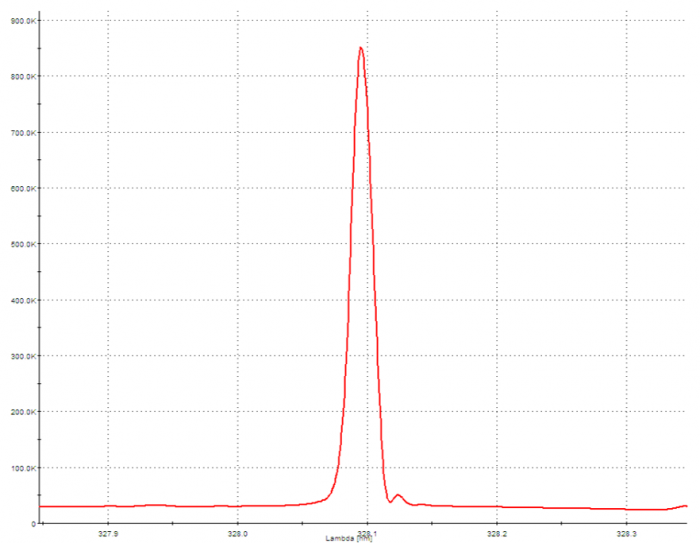
Compositional Analysis of SAC305 by ICP-OES: Isolated Silver Wavelength
In our industry, we care about the exact composition of alloys, as well as the concentration of impurities. ICP-OES analysis can be quite finicky, and testing bulk metals for metal analytes presents its own slew of challenges. Efficient dissolution of the samples requires the appropriate choice of acids and application of heat. For example, tin will not go into solution with nitric acid alone, but using hydrochloric acid runs the risk of precipitating silver, so preparing a sample of SAC305 requires some extra thought. If a variety of alloys are to be tested, the order of the analyses needs some rhyme and reason. When a sample is tested for impurities, the concentration of the compositional elements in the sample solution will be quite high. Some elements are more difficult to rinse out of the system than others. If a SAC305 sample is analyzed after a tin-lead sample, there is a concern that the lead levels detected in the SAC305 sample will be erroneously elevated, resulting in an unacceptable false positive. Being aware of the sequence of alloys and the effect each element has on the results will allow for accurate and consistent quantitation of impurities. Additionally, the presence of certain elements can interfere with the measurement of another element. An element will typically have a few wavelengths that are sensitive enough for impurity analysis. The report for a sample may show wildly different results between the wavelengths for a particular element, and a wavelength that works for one alloy matrix may be useless for another matrix. For example, in a sample of SAC305, the lead results for two commonly used wavelengths can agree, but in a sample of gold-tin, the lead results for the same two wavelengths will disagree, with only one result being accurate. It is important to understand the effect each element has on an emission spectrum, as well as the mathematics behind each result on a report.
I’ve only scratched the surface of the intricacies involved in the analysis of metals by ICP-OES. Here at Indium Corporation, our quality team uses their wealth of experience in analytical chemistry to provide quality products that meet or exceed customer needs, expectations, and requirements. For a catalog of solder alloys offered by Indium Corporation, click here to visit the Solder Alloy Selector Guide.