Folks,
When following the elections last fall, we often heard that a certain poll either was or was not statistically significant. As an example, candidate A led candidate B in a 1,000-person poll 51 to 49%, but the results were not statistically significant because the margin of error (MOE) was a little more than 3%. Examples like this one deservedly give statistical significance a sense of importance. However, with very large sample sizes, this significance can be misleading. I have blogged on this topic before, but it bears repeating, especially with a quantitative example.
For this example, let’s look at some data from the SMT industry. Assume an engineer wants to evaluate 3 solder pastes on their performancefor transfer efficiency (TE). The target value is 100%. Paste 1 has a TE of 98%, paste 2’s TE is 97%, and paste 3 comes in with a TE equal to 86%. The data on all of the pastes has a standard deviation of 20%. Unfortunately, her company has yet to purchase a modern SPI (solder paste inspection) type volume measuring device, soshe has to measure all solder paste deposit volumes with a microscope. So, she only measures twenty samples for each paste. With the above data and 20 samples each she can perform some statistical calculations and show, with 95% confidence, that there is no statistically significant difference in TE between pastes 1 and 2, but that both pastes are superior to paste 3.
However, one month later her company purchases an SPI tool. It can scan solder paste deposits so rapidly that she scans 20,000 deposits for each of the 3 pastes. It is comforting that the SPI produces exactly the same results, i.e. paste 1 has a TE of 98%, paste 2’s TE is 97%, and paste 3 has a TE equal to 86%. All pastes still show a standard deviation of 20%.
So, we have the same results right? Well, no. Of course pastes 1 and 2 still beat out paste 3, but, in this case, paste 1 is now statistically superior to paste 2. As a matter of fact, even if paste 2 came inwith a TE of97.67%, paste 1 would be statistically superior to paste 2 with 95% confidence.
What causes this change? It relates to the sample size. The 95% confidence interval of the mean (CIM) is determined, in part, by the standard deviation divided by the square root of the sample size. This term is called the standard error of the mean (SEM).
As the sample size goes up, the SEM gets smaller. Figure 1 shows a comparison of the sampling distributions of the means for paste 1 and 2 when the sample size is 20; Figure 2 show it when the sample size is 20,000. The confidence intervals of the mean for each distributionare shown by lines with arrow heads. Note that, for a sample size of 20, in Figure 1, that the CIMs strongly overlap, suggesting that there is no statistical difference. Whereas, in Figure 2, the CIMs are widely separated, suggesting that these two distributions are strongly statistically different.
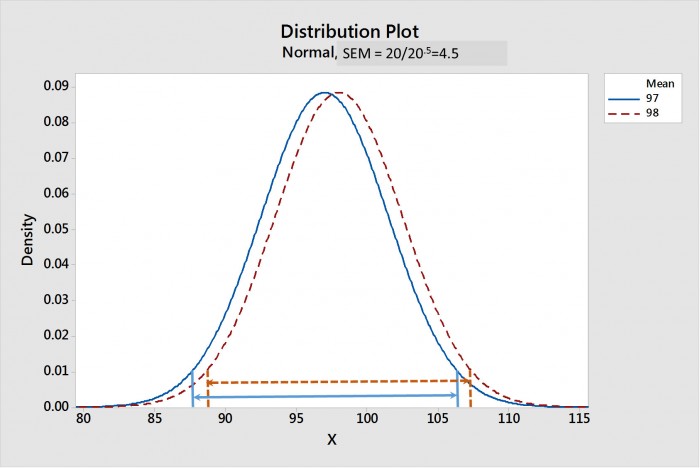
Figure 1. The sampling distribution of the means forpastes 1 and 2 with a sample size of 20. The 95% confidence intervals of the means (CIMs)are shown by the arrowed lines. Note that the CIMs overlap, suggestinganostatistical difference.

Figure 2. The sampling distribution of the means forpastes 1 and 2 with a sample size of 20,000. The 95% confidence intervals of the means (CIMs)are shown by the arrowed lines. Note that the CIMs do not overlap, suggestinga strongstatistical difference.
Where does this situation leave us?
Clearly if a sample size of 20,000 allows us to say that there is a statistically significant difference between an average TE of 98% and one of 97.67% we have to question its value. As an example, suppose that management has determined that TE is the most critical parameter in purchasing a solder paste. Let’s also suppose that paste 1 has the 98% TE and paste 2 has the statistically different 97.67% TE. However, paste 1 has a very poor response to pause. Let’s also assume all other performance metrics are the same. In this case I would argue that the TEs of pastes 1 and 2 are not “practically significantly” different and should be considered the same. Adding the superior response to pause performance of paste 2 should make it the winner.
How is “practical significance” determined? It will vary from case to case, but I would argue that, with TE, a difference in the 2 to 5% range is not practically significant. In most cases, engineering should determine “practical significance” with some experiments. However, with modern tools like SPI devices, that can measure thousands of data points, I can see the need to understand the statistical and practical difference dichotomy becoming more and more common.
This situation became more real to me as I just recently analyzed some TE data with sample sizes over 20,000.
Cheers,
Dr. Ron