Folks,
C Charts are control charts used to track attribute data. As an example, suppose you are tracking defects at the end of an SMT assembly process. Management hasstated that they want to know how many defects there are per 10,000 assemblies. So, for every 10,000 assemblies manufactured, you track the number of defects. Let’s assume that, as lead process engineer, you have been collecting these attribute data for 6 months. To make the analysis simple, let’s also assume that this is how many assemblies are manufactured each day. A C Chart of the data is shown in figure 1. The Shewhart Rule 1 violation noted is almost certainly due to common cause variation.
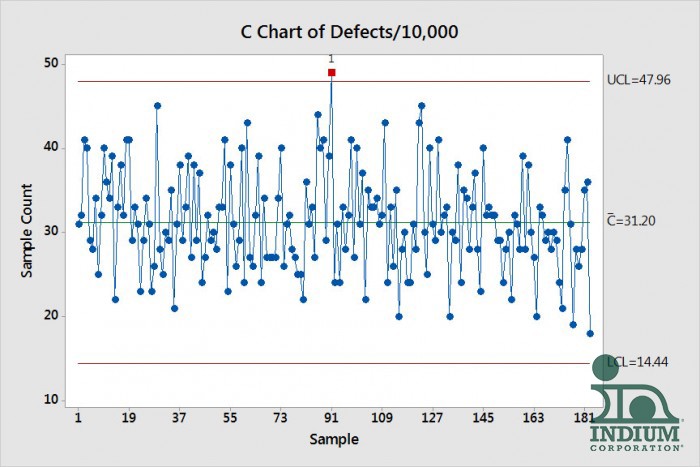
Figure 1. C Chart Data for data sets of 10,000.
You head out for a two week vacation and a few of your overworked colleagues agree to monitor the line and collect the attribute data. Unfortunately, due to your absence, there are a few process issues in the assembly line. As a result, only 5,000 assemblies are produced each day. Management wants to compare the new data to the old, but the sample sizes are different. It is reasonable to simply multiply the number of defects per 5,000 by the ratio of the sample sizes, in this case the ratio is 2 (10,000/5,000). These new modified data can be added to the old data to plot an updated C Chart. In our case, the first three days of defect data were 31, 23, and 21 defects per 5,000 assemblies. Multiplied by 2, these data points now become 62, 46, and 42. Performing this simple operation on the two weeks' worth of data and adding them to the old C Chart results in the new C Chart in figure 2.
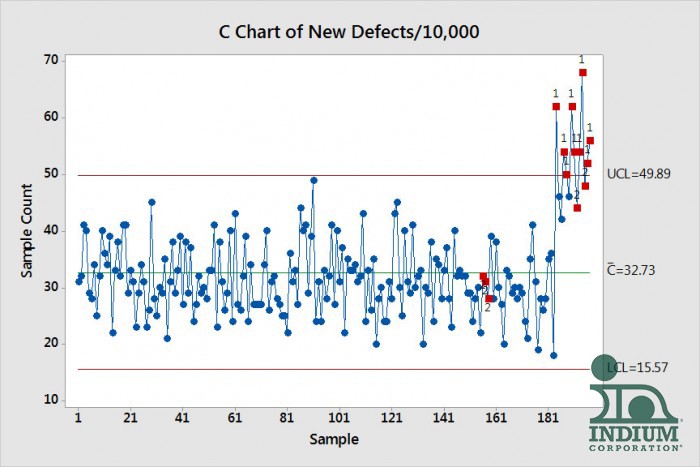
Figure 2. By multiplying each of the number of fails in the new data set by 2 we are able to add the new data to the old data and generate a new C Chart.Note that the defect rate for the new data is greater as witnessed by the many Shewhart Rule 1 violations.
Note that the new data clearly shows a higher failure rate as indicated by the many Shewhart Rule 1 violations. These results strongly support the good work that you must be doing to support the assembly process. Not only did the production go down 50%, but the defect rate went up significantly during your absence.
I have developed an Excelspreadsheet to make these data conversions. If you are interested, send me an email and I will send you the spreadsheet.
Cheers,
Dr. Ron