Folks,
Our discussion of Weibull Analysis continues…..Let’s say you have worked hard and assembled some SMT lead-free PCBs for thermal cycle testing. You used the best lead-free solder paste, and some lead-free solder preforms as you assembled several through-hole components with the Pin-in Paste process. You were a little concerned with the assembly process as the board was thermally and physically massive and the reflow process needed to be a bit above the recommended temperature and time.
The results of the thermal cycle testing are shown in Figure 1 below. You dutifully report the characteristic life (or scale) as 2,387 cycles and the first fail at 300 cycles. You were quite disappointed, as in the past similar, but slightly smaller boards, had a slightly higher scale, but more importantly, the first fail was about 1,000 cycles. Anyway, you write you report up and file it away.
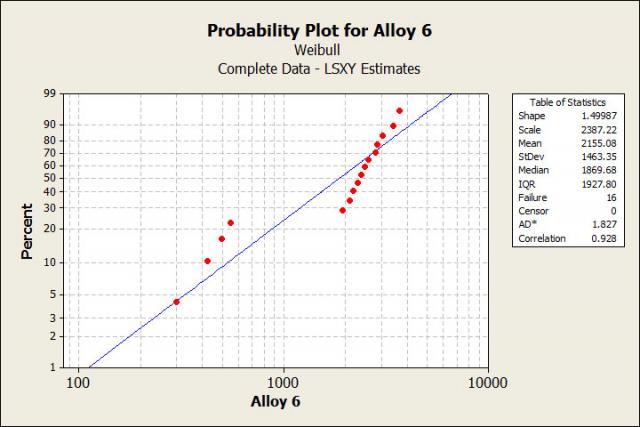
Figure 1. A Weibull Plot of the Thermal Cycle Data
Hold on! The data are screaming at you the something is going on. Look at the same data in Figure 2. Note two distinct lines shown in green. These two separate lines suggest very strongly that there are multiple failure modes. The line furthest to the right is likely the typical failure mode observed in the past. The line to the left is a new early failure mode. It could be due to something like oxidized pads or some other phenomena not seen when testing similar but smaller boards. Root cause failure analysis should be performed to try and understand to new failure mode.

Figure 2. A Weibull Plot of the Thermal Cycle Data with Multiple Failure Modes Noted
Now for a human interest note:
One of the rewarding aspects of being a professor at Dartmouth is the outstanding nature of many of the students. They are not just good academically, but often are talented artistically, athletically, etc. This point was brought home to me recently. In a class I teach, ENGS 1: The Technology of Everyday Things, we were recently discussing the conservation of angular momentum (CoAM). One of the most striking ways to demonstrate CoAM is an ice skater’s spin. I went on the internet and could not find a good video of a spin. I then remembered that one of my former students, Julia Zaskorski was on Dartmouth’s figure skating team. I asked her if she had a video she could share. It appears below. She is a materials science and physics major. Who knows, maybe we will see her at APEX or SMTAI in a few years.
Here is a little bio in her own words:
My name is Julia Zaskorski, and I’m a junior from Wellesley College taking part in the 12 College Exchange Program at Dartmouth. At Wellesley I am majoring in physics with the intent to pursue mechanical engineering. Despite Wellesley’s relationship with nearby MIT, Wellesley does not have its own engineering program, so I sought out the more self-contained curriculum and atmosphere at the Thayer School of Engineering. In addition to the draw of the Thayer School, the Dartmouth Figure Skating team was also a hugely motivating factor for my exchange, as Wellesley does not have a team, let alone a rink. I have known the coach of the Dartmouth team for several years now, and to finally see my name on the roster for the team is a dream come true. The engineers, as well as the winter activities here in Hanover, pulled my heart to Dartmouth long before I’d ever set foot on campus.
Cheers,
Dr .Ron