Folks,
In my last post, I discussed the concern for copper-tin intermetallic (IMC) growth in solder joints at high service temperatures. Since then, I have developed an Excel® spreadsheet that will calculate IMC growth at any temperature, T, for times from 1 to 100,000 hrs. See Figure 1 for the input for this spreadsheet. The user only has to enter the value of temperature in degrees Celsius in cell A2 and the IMC thickness is calculated and displayed in cells D2 through D7 for times 1 to 100,000 hrs.
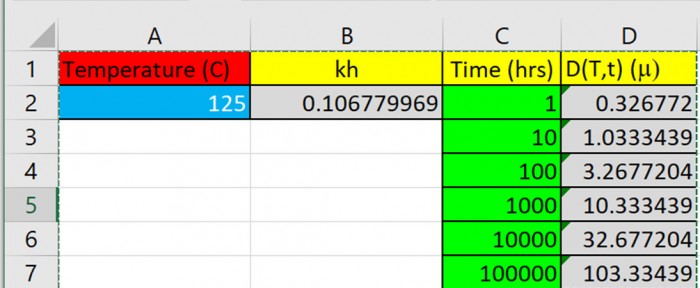
Figure 1. The input to calculate IMC thickness.
The IMC thickness is also plotted in a graph as shown in Figure 2. If you are interested in a copy of this spreadsheet, send me an email at [email protected].
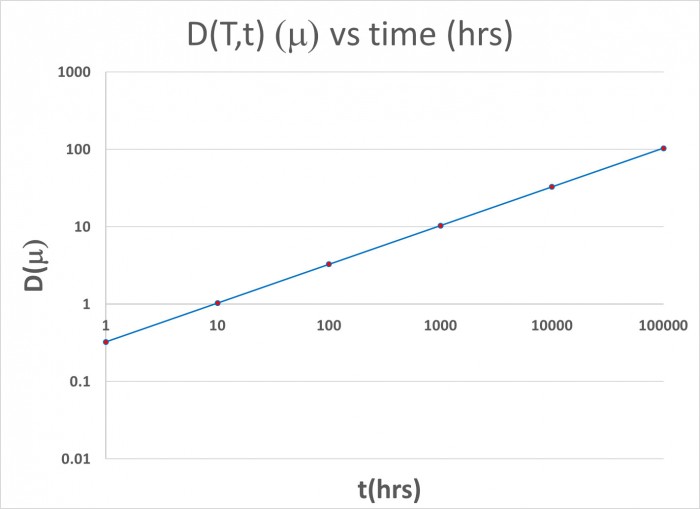
Figure 2. The output graph of IMC thickness at a specific temperature versus time.
It is important to note that these calculated IMC thickness values are only approximations from Siewert’s data as found in his paper: Siewert, T. A. etal, Formation and Growth of Intermetallics at the Interface between Lead-Free Solders and Copper Substrates, APEX 1994. So, caution is advised, however, I expect the values calculated by the spreadsheet to be correct to within a factor of two.
Cheers,
Dr. Ron