Folks,
In my last post, I shared about an Excel®-based software toolcalled Line Balancer™to help candidates for SMTA Certification prepare for the line balancing part of the program. They can use Line Balancer™ to check the correctness of practice line balancing problems. This post will discuss another Excel®-based software tool, Reflow Profiler™, to help candidates prep for the reflow profiling part of the certification.
Typically, the reflow profiling goal is to determine if the reflow profile matches the requirements of the solder paste specification.
As an example, let’s consider a reflow profile as shown in Figure 1. The solder paste specification is shown in Figure 2. We will first solve the problem by hand and then use the software.

Figure 1. A ramp-to-peak reflow profile.
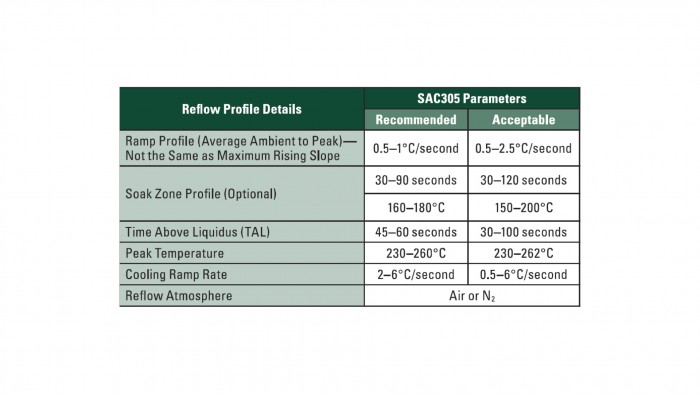
Figure 2. The solder paste reflow specification
The first task is to determine if the ramp-to-peak rate matches the solder paste specification outlined in red in the specification shown in Figure 3. By measuring the change in temperature in Figure 4 from point A to B and dividing it by the change in time from those points, we see in Figure 4 that the ramp-to peak-rate is 0.857 C/seconds, and is within therecommended specifications 0.5 to 1.0 C/second.
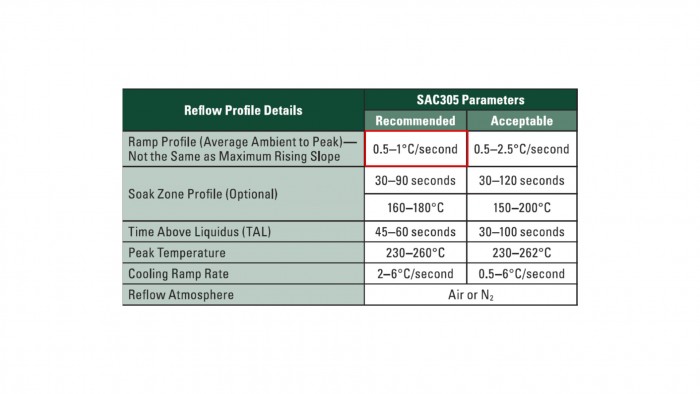
Figure 3. The solder paste specification with the ramp-to-peak rate highlighted.

Figure 4. The reflow profile with the ramp-to-peak rate calculated.
Figure 5 shows the solder paste specification with the time above liquidus (TAL) with the peak temperature highlighted. While Figure 6 shows the reflow profile, where the TAL is measured as 60 seconds and the peak temperature at 240C, both are consistent with the recommended values.

Figure 5. The solder paste specification with the TAL and peak temperature highlighted.
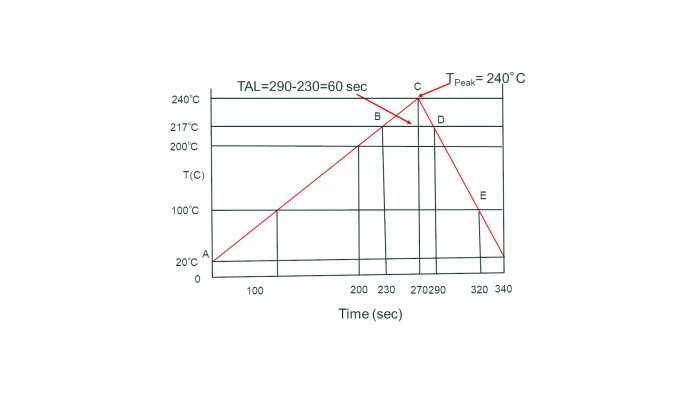
Figure 6. The reflow profile with the TAL and peak temperature identified.
Lastly, Figure 7 shows the solder paste specification with the cooling ramp rate highlighted and Figure 8 shows the reflow profile with the cooling rate calculated as -2.8 C/s, again within the specification.

Figure 7. The solder paste specification with the cooling rate highlighted.
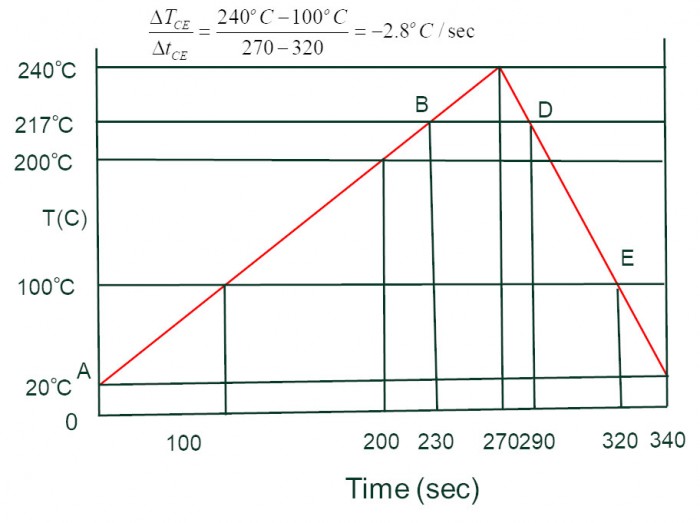
Figure 8. The reflow profile with the cooling rate calculated.
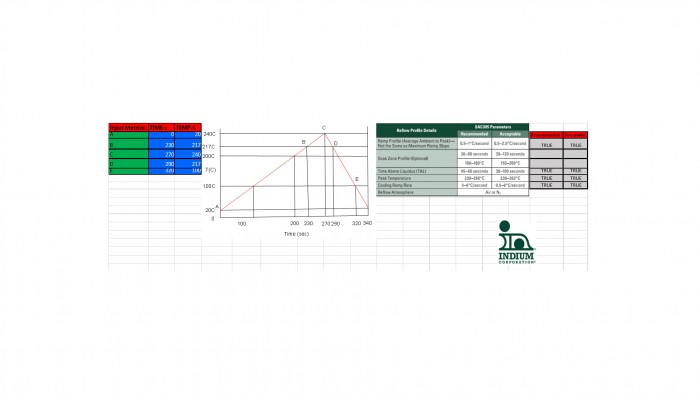
Figure 9 shows all of the calculations performed and matched to the specification with Reflow Profiler™.
If you are interested in a copy of Reflow Profiler™, send me an email at [email protected].
Cheers,
Dr. Ron