Folks,
Let's continue watching Patty help Mark to determine small P values in hypothesis testing. The first part of this story is here.
Patty and Mark chatted for awhile and reviewed some of the data that Mark was analyzing.
“Mark, to simplify it, let’s assume that you are comparing a transfer efficiency (TE) to another;say you have taken 100 TE readings, and you want to see if they are statistically greater than some value. So we would have a null hypothesis of94% and an alternative hypothesis of greater than 94%,"Patty said.
Patty went to her white board and wrote it out:
Ho: Mean = 94%
H1: Mean >94%
“Let’s assume that the mean of the hundred readings is 100% and the standard deviation is 10%,” she continued.
“That’s just about exactly what the data were,” responded Mark.
Patty entered these data into Minitab and obtained the following output:
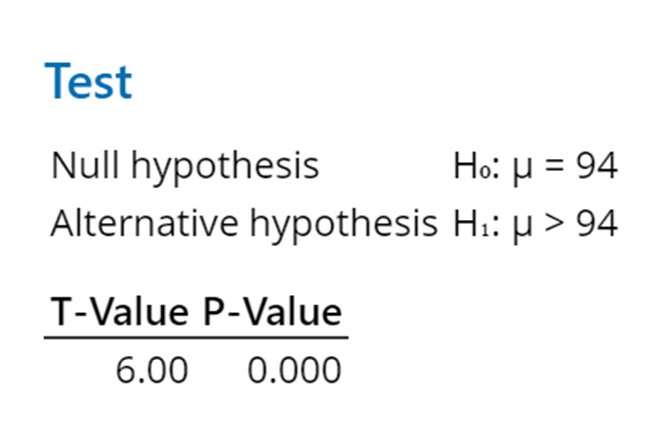
“So we reject the null hypothesis and conclude that the mean (i.e. 100) is statistically greater than 94%,” said Patty.
“But itsays the P value is 0.000”, groaned Mark. “That is why Mike chewed meout,” he sighed.
“Let’s use Minitab to plot a graph of the normal distribution, with a mean of 0 and a standard deviation of 1 and see where 6 is on the graph. The 6 is equivalent to a T- Value of 6 (or a Z-Value if the sample size is large, say over 400),” Patty said. See Figure 1.

Figure 1. The Minitab Graphical Output.
“Wow,there is the P-Value, 9.8659×10⁻¹⁰,"exclaimed Mark.
“It ends up that even this graphing function calculates a value of P-Value of 0 for T, or Z, values greater than about 8,” Patty confirmed.
“Yikes, so Mike might still chew me out if the T valueis 8 or more,” Mark moaned.
“Take heart,” said Patty, “I solved the calculus of the integral of the Guassian and found out that it is a complimentary error function. Excel® will calculate complimentary error functions to a T or Z value of up to37.5.In this case, the associated P value is 4.61E-308.” See Figure 2.
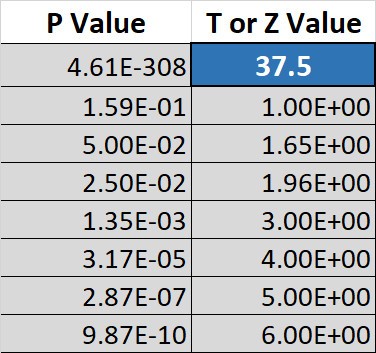
Figure 2. Patty's Excel Spreadsheet to Calculate P Values.
Mark pleaded, “and if it is larger than 37.5?”
“When you considerthat there are only about 1080 atoms in the universe, let’s not worry about 4.61E-308, since this is one chance in 2.16E307,” joked Patty. “However, if you every really need to go beyond T = 37.5, I have developed techniques that go to T well over 1000, probably to any number, but they can’t be done with Excel®, “ shecontinued.
Mark asked hopefully, “so I can have the Excel® spreadsheet and if I ever have to go beyond T =37.5, you’ll help me, right?"
“Sure thing,” Patty said. “Oh, and don’t be so intimidated by Mike Madigan…he’s really just a big Teddy Bear,” she teased.
At that they both chuckled, thoughMark not so convincingly.
Cheers,
Dr. Ron
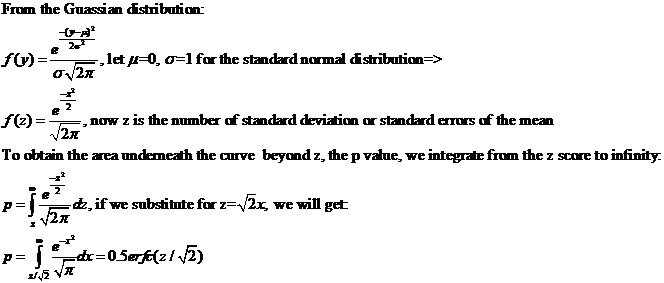
Patty’s integration of the Gaussian Normal Distribution function to the complimentary error function is below. Readers who would like a copy of the Excel® spreadsheet that calculates P values cansendan email to [email protected].