Folks,
With small sample sizes, say less than 200, the Normal Distribution needs a correction. William Sealy Gossett discovered this correction, while he worked at a Guiness Brewery. The corrected distribution is called the Student T Distribution, as Gossett published under the pseudonym “Student.” Today “Student” is usually dropped and the distribution is known as the “t distribution.”
One of the challenges of the t distribution is that a separate distribution exists for each degree of freedom (DOF) of the data. For the t distribution, the degrees of freedom are simply the sample size minus 1.
As an example, let’s say we have a sample of solder paste transfer efficiency data. The sample size is 100 and we want to see if we can say that the mean is 100%. We analyze the data with Minitab (see Figure 1)and see that the mean is 105.40 and the standard error of the mean is 1.03.
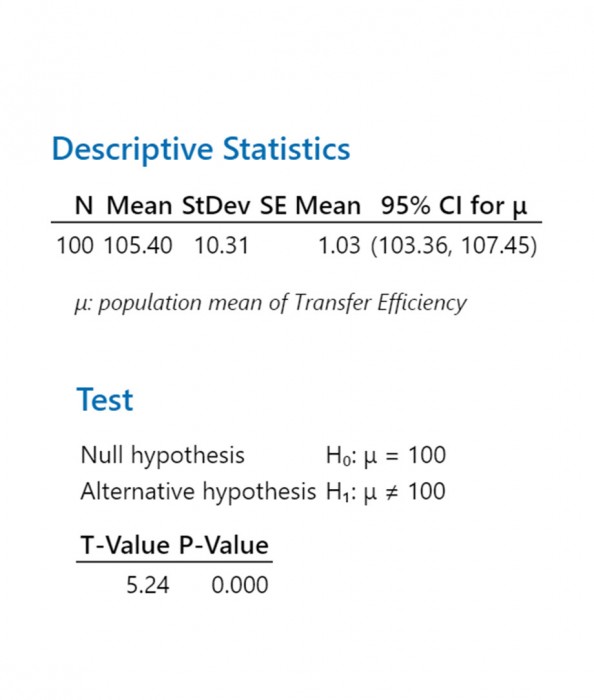
Figure 1. Minitab analysis of the data discussed above.
Performing a hypothesis test with H0 = 100 and H1 ≠ 100, we see that we reject the null hypothesis with a t value of 5.24 for this double-sided test. Minitab tells us that p = 0.000. Looking at the t table(see Figure 2) doesn’t help as for a DOF = 100 (close to our 100-1 = 99), the table only goes up tot = 3.39.
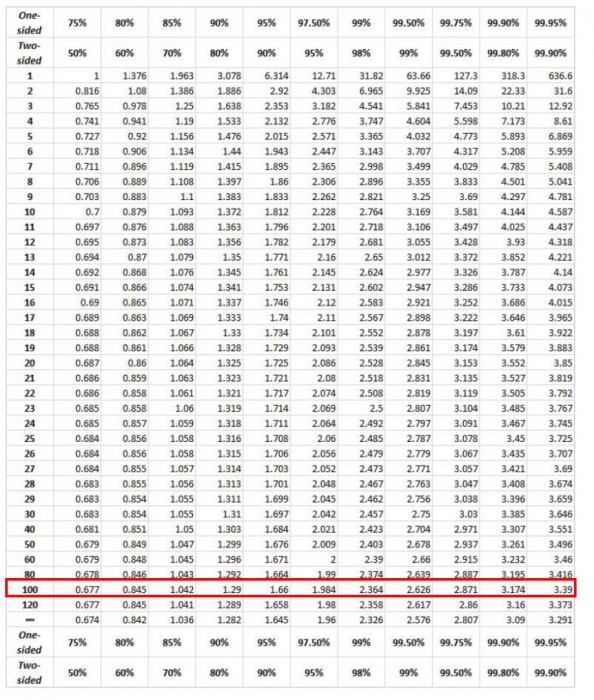
Figure 2. Tableof t values.
To overcome this shortcoming, I developed an Excel® software tool that calculates the p value for any given t with a given DOF. In our case, with t = 5.24 (entered into cell B2) and DOF = 99 (cell C2), the p value is 9.708 x 10⁻⁷(cell F3). See Figure 3. The interpretation of the p value is that if wereject the null hypothesis, wewould only be wrong about 1 in 1 million times (9.708 x 10⁻⁷ is approximately equal to 10-6).
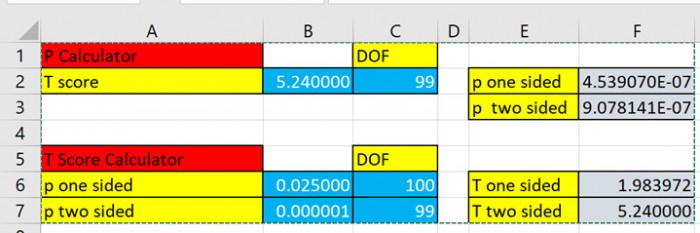
Figure 3. Output of Excel®spreadsheet to calculate t and p values.
The Excel® spreadsheet is also capable of calculating the t value for the p value and the number of DOF. So by inserting the p = 9.708 x 10⁻⁷(cell B7) and DOF = 99 (cell C7), we get t = 5.24 (cell F7), as seen in Figure 3. Note: Excel® rounds up cell B7 to 0.000001.
If you would like a copy of this spreadsheet, please send an email to me at [email protected].
Cheers,
Dr. Ron