Folks,
In my last post, I discussed an Excel® spreadsheet to calculate p values for hypothesis tests in which the t distribution is employed. The reason I developed this tool is that some statistics software like Minitab® or JMP®, after listing the t value, give the smallest p value as 0.001. If the p value is less than 0.001, it is simply given as 0.000. With the spreadsheet I developed, p values of less than 10-95 can be calculated. In this post, I will present an Excel spreadsheet to calculate p values for F statistics.
As an example of where the F statistic is used, consider a designed experiment (DOE) where we are testing three solder pastes (ACME, AJAX, and Kostco), two stencils (Stencil 1 and Stencil 2), and three operation temperatures (20°C, 25°C, and 30°C). There is a rumor in the industry that AJAX doesn’t print well at 20°C.
I used Minitab® to analyze the fictitious data that I developed for this DOE scenario. The Main Effects Plots are shown in Figure 1 and the Interaction Plots arein Figure 2. The goal for transfer efficiency is 100%, so ACME is slightly better than Kostco, both being significantly better than AJAX as seen in Figure 1. Figure 1 also indicates that Stencil 2 is slightly better than Stencil 1 and temperature makes a significant difference.
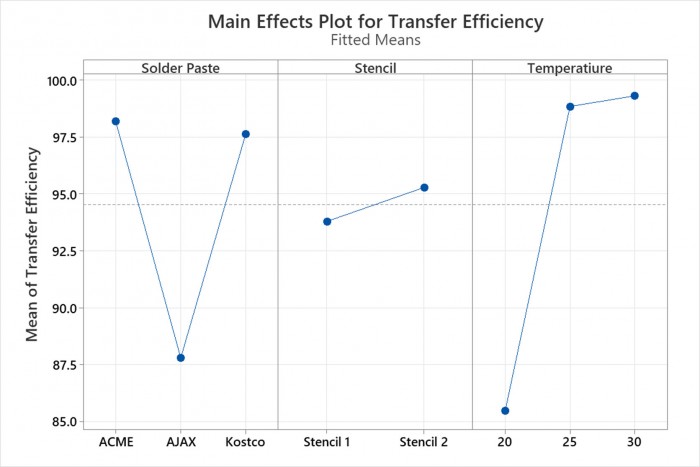
Figure 1. The Main Effects Plots for the Stencil PrintingDOE.
The Interaction Plots show that indeed AJAX has trouble printing at 20°C (see the red box in Figure 2). It is also clear from the graph in the red box that the other solder pastes do not have trouble printing at 20°C.
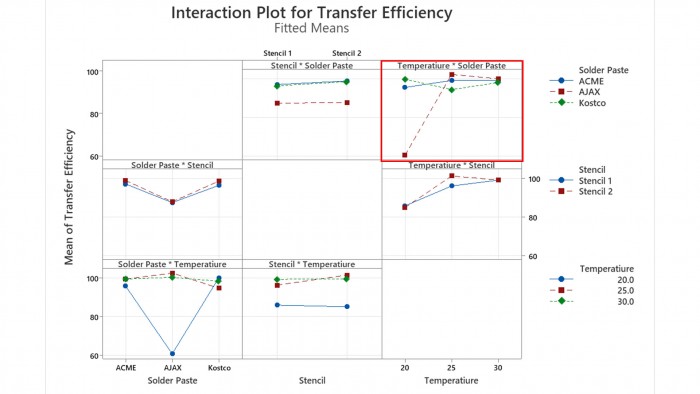
Figure 2. The Interactions Plots for the Stencil Prinitng DOE.
The table of the Minitab® Analysis of Variance output is shown in Figure 3. Note the various F statistics. In a DOE, an hypothesis test exists for each factor. As an example, consider the factor: stencil. In this case, the null hypothesis is that using Stencil 1 or 2 makes no difference in the results. The F statistic is the variation in the results from Stencil 1 and Stencil 2 divided by the random variation in the experiment. A high F statistic indicates that the difference between the stencils is important. In cases like this one, the F statistic is similar to the signal-to-noise ratio in electrical engineering. A high F statistic will also result in a small p. Typically, if p is < 0.05 the null hypothesis is rejected, indicating the that factor levels have an effect on the result.
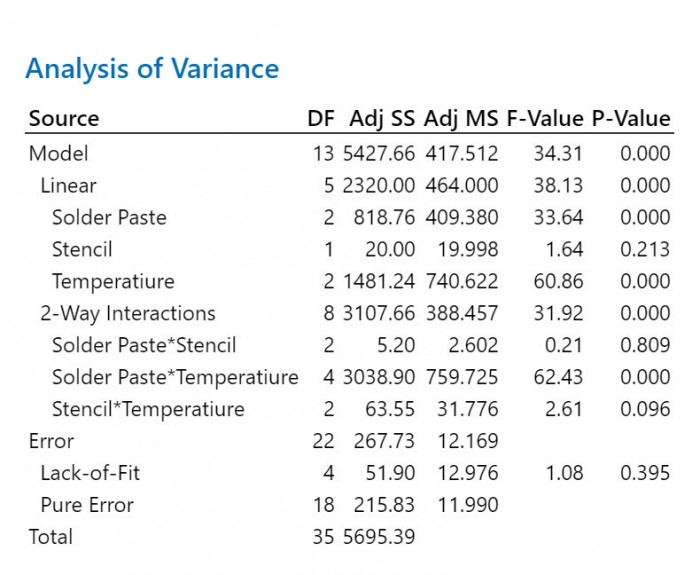
Figure 3. The Minitab® Analysis of Variance Output for the Stencil Printing DOE.
In Figure 3 we can see that the F statistic for stencils is 1.64. The degrees of freedom for the numerator (the stencils) is 1 and for the denominator (error)is 22. To check the Excel® spreadsheet I made, I entered these numbers and the p value output was 0.2136626, as shown in Figure 4, the same as Minitab’s 0.213. I find it interesting that Minitab® appears to truncate numbers, not round them. Note in Figure 4 that the spreadsheet also calculates the F statistic if the p value is entered into cell B6. Since p = 0.213, in this case, the difference is the stencils is not statistically significant.
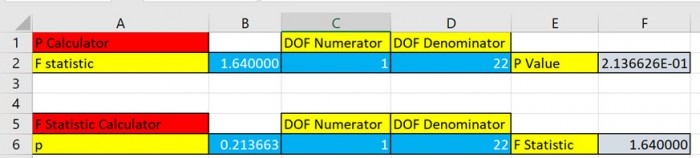
Figure 4. The p value calculation from the Excel spreadsheet forthe F statistic for stencils.
So, what about some of the other p values. Figure 3 shows us that Minitab® produces 0.000 for most of the p values. Let’s use the spreadsheet to calculate a few of them. For solder paste, we see the DOF is 2, while the F statistic is 33.64. Our spreadsheet gives a p value of 2.034012E-07(See Figure 5).

Figure 5. The p value calculation from the Excel spreadsheet forthe F statistic for solder pastes.
Send me an email, at [email protected], to get the spreadsheet. See if you get 1.088934E-11 for the solder paste-temperature interaction (See Figure 6).
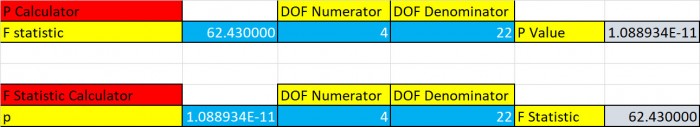
Figure 6. The p value calculation from the Excel spreadsheet forthe F statistic for the solder paste-temperature interaction.
Cheers,
Dr. Ron