乡亲们
在上一篇 文章中,我介绍了一个基于 Excel® 的软件工具 Line Balancer™,它可以帮助 SMTA 认证的候选人为该计划的线平衡部分做准备。他们可以使用 Line Balancer™ 检查线平衡练习题的正确性。本篇文章将讨论另一款基于 Excel® 的软件工具 Reflow Profiler™,帮助考生准备认证中的回流曲线测试部分。
Typically, the reflow profiling goal is to determine if the reflow profile matches the requirements of the solder paste specification.
As an example, let’s consider a reflow profile as shown in Figure 1. The solder paste specification is shown in Figure 2. We will first solve the problem by hand and then use the software.

Figure 1. A ramp-to-peak reflow profile.
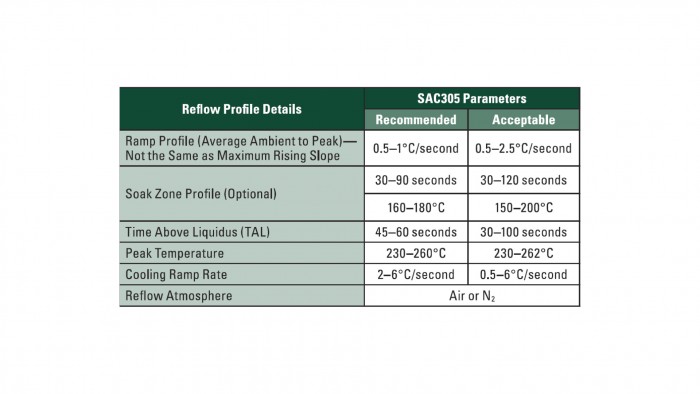
图 2.锡膏回流规格
第一项任务是确定斜坡-峰值速率是否符合图 3 所示规格中红色概述的焊膏规格。通过测量图 4 中从 A 点到 B 点的温度变化,并将其除以从这些点开始的时间变化,我们可以看到图 4 中的斜坡到峰值速率为 0.857 摄氏度/秒,符合 0.5 至 1.0 摄氏度/秒的建议规格。
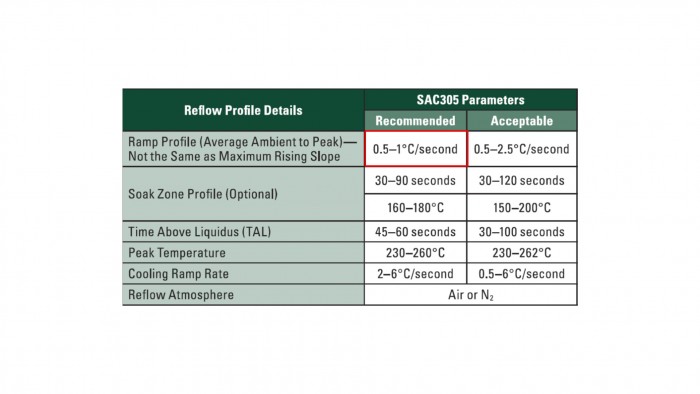
图 3.突出显示斜坡-峰值速率的焊膏规格。

Figure 4. The reflow profile with the ramp-to-peak rate calculated.
Figure 5 shows the solder paste specification with the time above liquidus (TAL) with the peak temperature highlighted. While Figure 6 shows the reflow profile, where the TAL is measured as 60 seconds and the peak temperature at 240C, both are consistent with the recommended values.

Figure 5. The solder paste specification with the TAL and peak temperature highlighted.
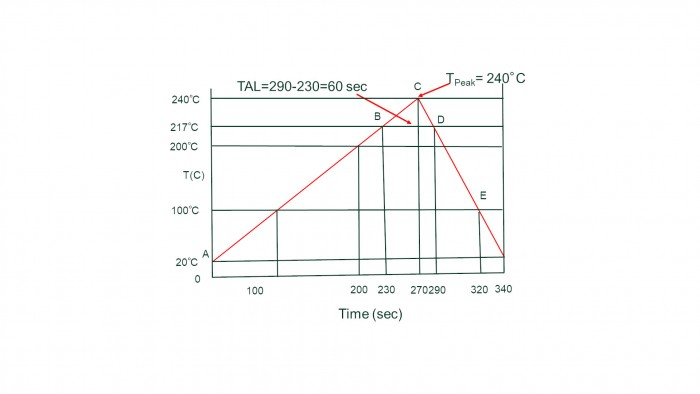
Figure 6. The reflow profile with the TAL and peak temperature identified.
Lastly, Figure 7 shows the solder paste specification with the cooling ramp rate highlighted and Figure 8 shows the reflow profile with the cooling rate calculated as -2.8 C/s, again within the specification.

图 7.突出显示冷却速度的焊膏规格。
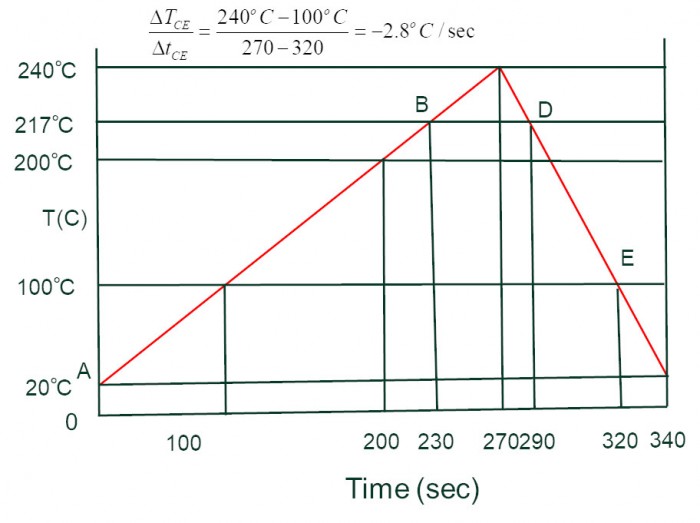
Figure 8. The reflow profile with the cooling rate calculated.
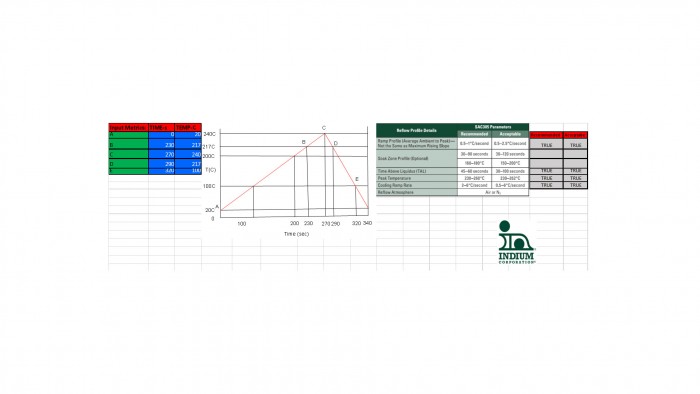
图 9 显示了使用 Reflow Profiler™ 进行的所有计算,并与规格相匹配。
如果您对 Reflow Profiler™ 的副本感兴趣,请发送电子邮件至 [email protected]。
干杯,
罗恩博士