
乡亲们
在关注去年秋天的选举时,我们经常会听说某项民意调查是或不是 有统计学意义. As an example, candidate A led candidate B in a 1,000-person poll 51 to 49%, but the results were not statistically significant because the 误差率 略高于 3%。像这样的例子理所应当地赋予统计意义以重要性。然而,在样本量非常大的情况下,这种显著性可能会产生误导。我曾在博客中讨论过这个话题,但有必要再重复一遍,尤其是用一个量化的例子来说明。
For this example, let’s look at some data from the SMT industry. Assume an engineer wants to evaluate 3 solder pastes on their performancefor transfer efficiency (TE). The target value is 100%. Paste 1 has a TE of 98%, paste 2’s TE is 97%, and paste 3 comes in with a TE equal to 86%. The data on all of the pastes has a standard deviation of 20%. Unfortunately, her company has yet to purchase a modern SPI(焊膏检测) 由于没有体积测量装置,她必须用显微镜测量所有焊膏的沉积体积。因此,她只能测量每种焊膏的 20 个样品。根据上述数据和每种焊膏 20 个样品,她可以进行一些统计计算,并以 95% 的置信度表明,焊膏 1 和焊膏 2 在 TE 方面没有显著的统计学差异,但这两种焊膏都优于焊膏 3。
However, one month later her company purchases an SPI tool. It can scan solder paste deposits so rapidly that she scans 20,000 deposits for each of the 3 pastes. It is comforting that the SPI produces exactly the same results, i.e. paste 1 has a TE of 98%, paste 2’s TE is 97%, and paste 3 has a TE equal to 86%. All pastes still show a standard deviation of 20%.
那么,我们的结果是一样的吗?当然不是。当然,浆糊 1 和 2 仍然胜过浆糊 3,但是,在这种情况下,浆糊 1 现在在统计上优于浆糊 2。事实上,即使浆糊 2 的 TE 值为 97.67%,在 95% 的置信度下,浆糊 1 也会在统计上优于浆糊 2。
What causes this change? It relates to the sample size. The 95% confidence interval of the mean (CIM) is determined, in part, by the standard deviation divided by the square root of the sample size. This term is called the 均值标准误差 (SEM).
随着样本量的增加,SEM 也会变小。图 1 显示了 均值的抽样分布 当样本量为 20 时,图 1 和图 2 显示的是粘贴 1 和粘贴 2 的平均值;当样本量为 20,000 时,图 2 显示的是粘贴 1 和粘贴 2 的平均值。每个分布的平均值置信区间用带箭头的线表示。请注意,在图 1 中,当样本量为 20 时,CIM 高度重合,表明没有统计差异。而在图 2 中,CIMs 相距甚远,表明这两种分布在统计上有很大差异。
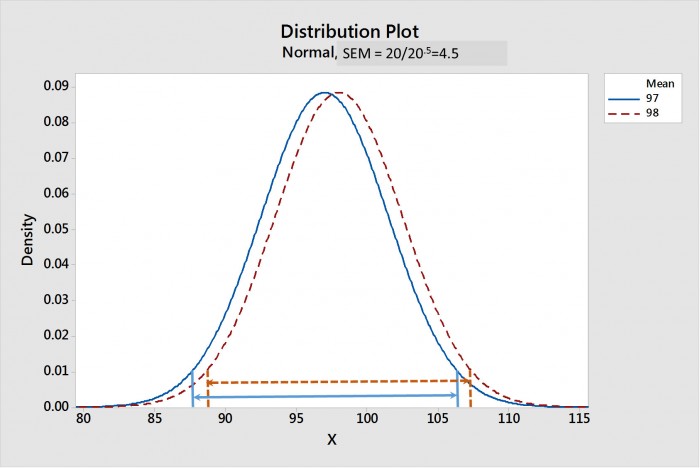
图 1.样本数为 20 的样本 1 和 2 的均值的抽样分布。均值的 95% 置信区间(CIMs)由箭头线表示。请注意,CIMs 重叠在一起,表明存在统计差异。

图 2.样本数为 20,000 的样本 1 和 2 的均值的抽样分布。均值的 95% 置信区间(CIMs)由箭头线表示。请注意,CIMs 没有重叠,这表明统计差异很大。
这种情况让我们何去何从?
显然,如果 20,000 个样本的数量可以让我们说平均 TE 值为 98% 和 97.67% 之间存在统计学意义上的显著差异,我们就必须质疑其价值。举个例子,假设管理层认为 TE 是购买焊膏时最关键的参数。又假设焊膏 1 的 TE 值为 98%,而焊膏 2 的 TE 值为 97.67%,两者在统计上存在差异。但是,焊膏 1 对停顿的反应很差。我们还假设所有其他性能指标都相同。在这种情况下,我认为浆糊 1 和 2 的 TE 没有 "实际显著 "差异,应视为相同。如果再加上浆糊 2 对暂停的响应性能更优越,那么它就会胜出。
How is “practical significance” determined? It will vary from case to case, but I would argue that, with TE, a difference in the 2 to 5% range is not practically significant. In most cases, engineering should determine “practical significance” with some experiments. However, with modern tools like SPI devices, that can measure thousands of data points, I can see the need to understand the statistical and practical difference dichotomy becoming more and more common.
最近,我分析了一些样本量超过 20,000 的 TE 数据,这种情况对我来说变得更加真实。
干杯
罗恩博士