乡亲们
我认识的每个人都公认这样一个事实:三分之二rd of all SMT defects can be traced back to the stencil printing process. A number of us have tried to find a reference for this posit, with no success. If any reader knows of one, please let me know. Assuming this adage is true, the right amount of solder paste, squarely printed on the pad is a profoundly important metric.
基于这种观点,前些时候我写了一篇 发帖 关于计算的置信区间 Cpk of the transfer efficiency in stencil printing. As a reminder, transfer efficiency is the ratio of the volume of the solder paste deposit divided by the volume of the stencil aperture. See Figure 1. Typically the goal would be 100% with upper and lower specs being 150% and 50% respectively.

Figure 1. The transfer efficiency in stencil printing is the volume of the solder paste deposit divided by the volume of the stencil aperture. Typically 100% is the goal.
I chose Cpk as the best metric to evaluate stencil printing transfer efficiencyas it incorporates both the average and the standard deviation (即“离散度”)。图2显示了糊剂A的分布情况:其数据位于规格范围中心且分布尖锐,因此具有良好的Cpk值;而糊剂B的分布既未居中于规格范围,且分布范围较宽。
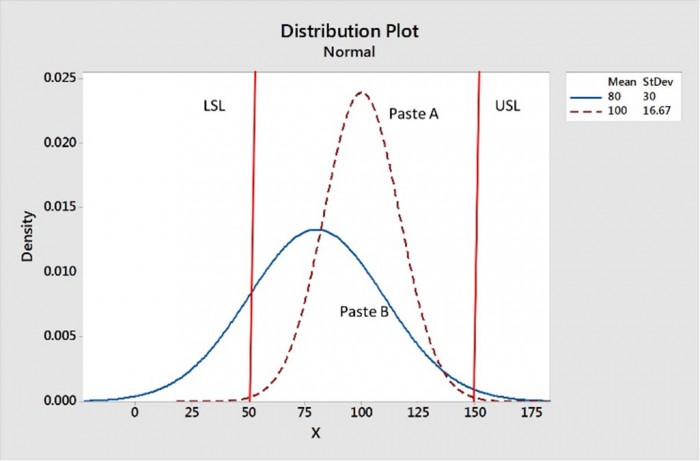
Figure 2. Paste A has the better transfer efficiency as its data are centered between the upper and lower specs, and it has a sharper distribution.
最近,我决定开发数学模型,以创建一个能够执行...的Excel电子表格。 假设检验 关于Cpks。据我所知,这在以前从未实现过。
An hypothesis test might look something like the following. The null hypothesis (Ho) would be that the Cpk of the transfer efficiency is 1.00. The alternative hypothesis, H1, could be that the Cpk is not equal to 1.00. H1 could also be that H1 was less than or great than 1.00.
As an example, let’s say that you want the Cpk of the transfer efficiency to be 1.00. You analyze 1000 prints and get a Cpk of 0.98. Is all lost? Not necessarily, since this was a statistical sampling, you should perform a hypothesis test. See Figure 3. In cell B16 the Cpk = 0.98 was entered, in cell B17 the sample size n = 1000 is entered, and in cell B18 the null hypothesis: Cpk = 1.00 is entered. Cell B21 shows that the null hypothesis cannot be rejected as false as the alternative hypothesis is false. So we cannot say statistically that Cpk is not equal to 1.00.
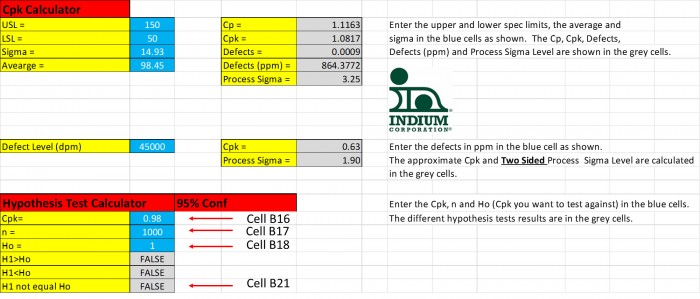
图3.A Cpk = 0.98在统计学上等同于Cpk = 1.00,因为原假设Ho无法被拒绝。
在这个1000个样本的例子中,Cpk值需要与1.00相差多少,才能在统计学意义上认定其不等于1.00?图4显示,Cpk值需达到0.95(或1.05)才能在统计学意义上与1.00存在显著差异。

图4. 若Cpk值仅为0.95,则该Cpk值在统计学上与Cpk=1.00存在显著差异。
This spreadsheet should be useful to those who are interested in monitoring transfer efficiency Cpks to reduce end-of-line soldering defects. I will send a copy of this spreadsheet to readers who are interested. If you would like one, send me an email request to [email protected].
干杯
罗恩博士